
 Since one year ago:
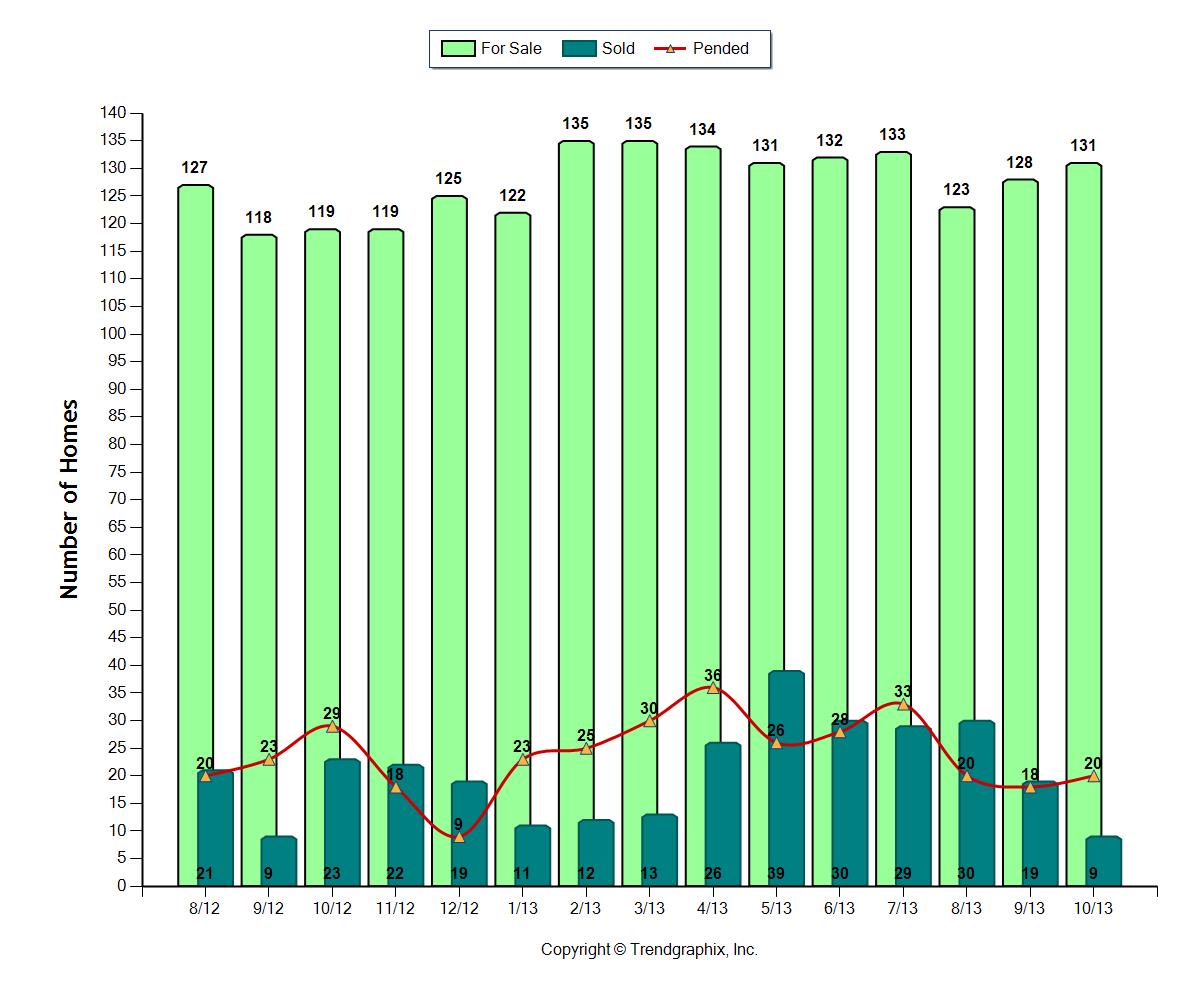
Tthe number of active listings is up 10.1% while the sold properties are down 60.9%.
The pended listings are down 31%. When the PENDED LISTINGS indicator is rising, our market is in recovery, which means contracts have been written and are anticipated to close. Obviously, since the inventory has been so low, the number of sales will be low as well.
Average home prices are up 16.9%. The price per square foot of a single family residence is approximately $238 per square foot – which is a decrease of 11.5% over last year – however, still higher than it was in December of 2012 and in April of 2013.
Part of the reason for the shortage of inventory: Homes remain on the market an average of 92 days — a decrease of 13.2% over last year. Homes are selling within 1.1% (up) of their originally listed price.
The average listed price in Pinecrest, Florida is $1,811,000 — a 6.5% increase over last year. The average sold price is $1,253,000.
Important information: Months of Inventory. Currently, Pinecrest, Florida is experiencing 14.6 months of inventory which is indicative of a Buyer’s market. This may be indicative of the fact that many of the homes are listed over $2M and the buyers may be looking $1M and under.
To see what has closed in Pinecrest, Florida for the last six months, click on the button below:

It is time to list, time to sell, time to upsize, time to downsize — money is still inexpensive to borrow.
Consider what is happening nationally:
http://www.youtube.com/watch?v=D9qsyHSDm2M&feature=c4-overview&list=UUYtGzq6NWZobuP02mpK_FPA
1 comment on “For Training: Market Trends: October 2013–Things Are Looking Up In Pinecrest, Florida”